IC Markets Home Assinar em Web Trader Contacte-nos
IC Markets Social IC Markets Social

Centro de Informação para
Traders Sérios

  • Sobre nós
  • ABRA UMA CONTA DE NEGOCIAÇÃO
  • TESTE UM DEMO GRATUITO
  • Comece a Operar
  • Visite nosso blog
IC Markets Social
  • Sobre nós
  • ABRA UMA CONTA DE NEGOCIAÇÃO
  • TESTE UM DEMO GRATUITO
  • Comece a Operar
  • Visite nosso blog
March 15, 2023Australian_Stocks_enIC Markets

Hong Kong 50 Index has broken through resistance

Hong Kong 50 Index has broken through a resistance line. It has touched this line at least twice in the last 9 days. This breakout may indicate a potential move to 19836.2248 within the next 2 days. Because we have seen it retrace from this position in the past, one should wait for confirmation of […]

Read more
March 14, 2023Australian_Stocks_enIC Markets

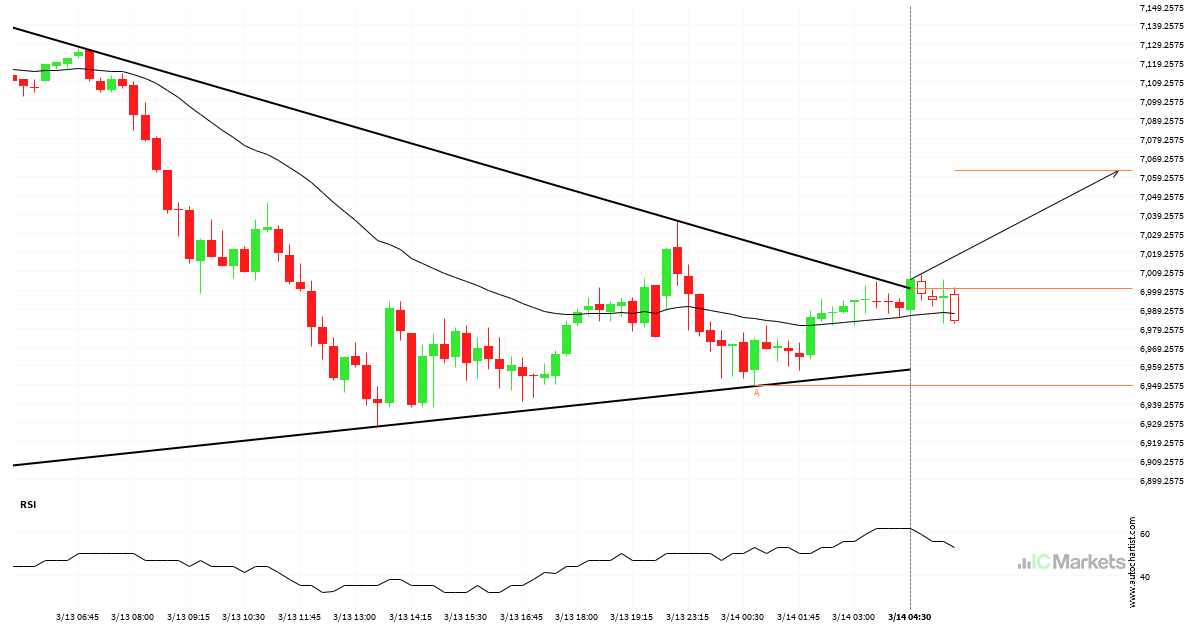
Resistance line breached by Australia 200 Index

Australia 200 Index has broken through the resistance line which it has tested twice in the past. We have seen it retrace from this line before, so one should wait for confirmation of the breakout before trading. If this new trend persists, a target level of around 7062.4851 may materialize within the next 5 hours.

Read more
March 13, 2023Australian_Stocks_enIC Markets

Will Hong Kong 50 Index have enough momentum to break resistance?

Hong Kong 50 Index is heading towards the resistance line of a Triangle and could reach this point within the next 9 hours. It has tested this line numerous times in the past, and this time could be no different from the past, ending in a rebound instead of a breakout. If the breakout doesn’t […]

Read more
March 13, 2023Australian_Stocks_enIC Markets

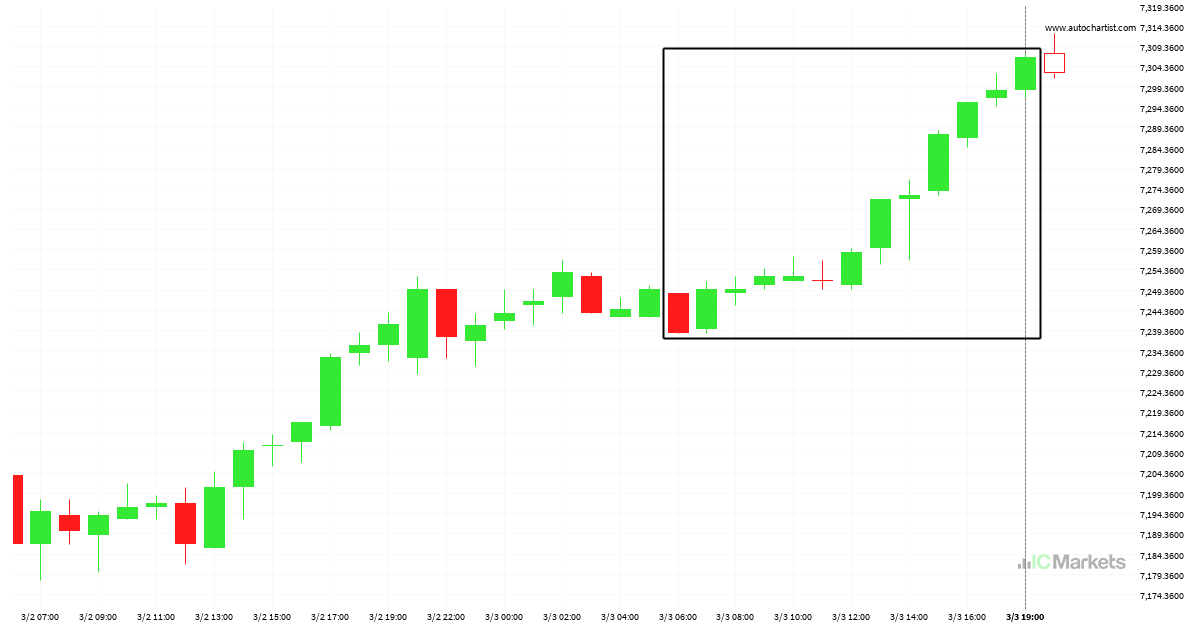
Huge bullish move on Australia 200 Index

Australia 200 Index has moved higher by 0.37% from 7104.52 to 7130.52 in the last 4 hours.

Read more
March 12, 2023Australian_Stocks_enIC Markets

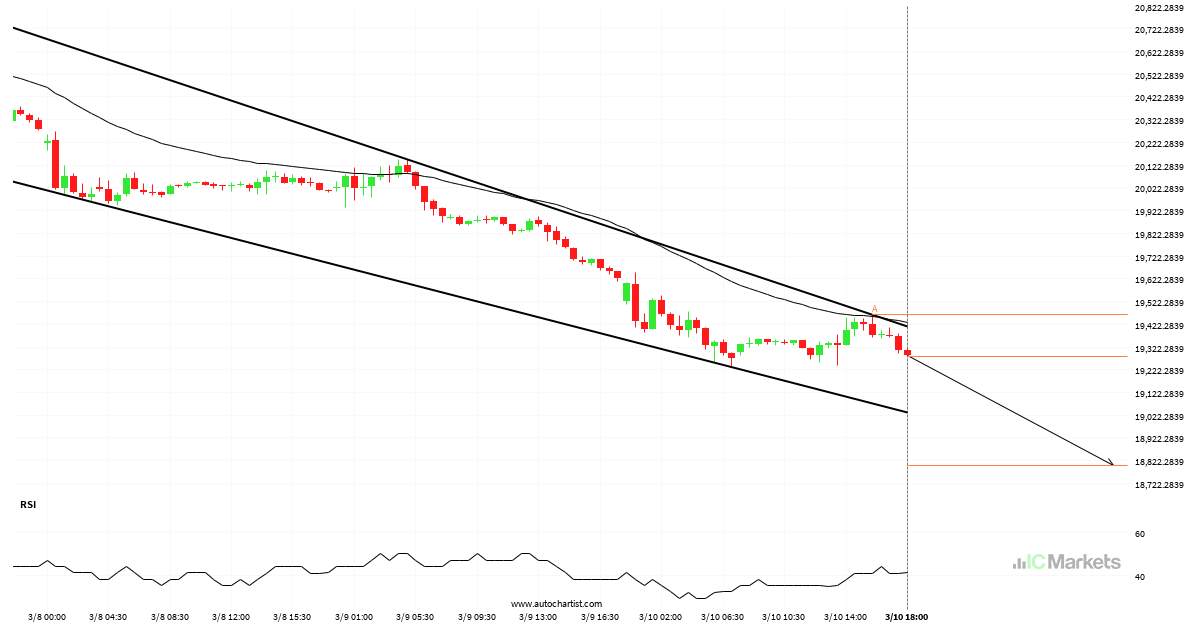
Hong Kong 50 Index approaching support of a Channel Down

Hong Kong 50 Index is approaching the support line of a Channel Down. It has touched this line numerous times in the last 4 days. If it tests this line again, it should do so in the next 15 hours.

Read more
March 8, 2023Australian_Stocks_enIC Markets

Will Australia 200 Index have enough momentum to break resistance?

Australia 200 Index is heading towards the resistance line of a Channel Up and could reach this point within the next 2 days. It has tested this line numerous times in the past, and this time could be no different from the past, ending in a rebound instead of a breakout. If the breakout doesn’t […]

Read more
March 8, 2023Australian_Stocks_enIC Markets

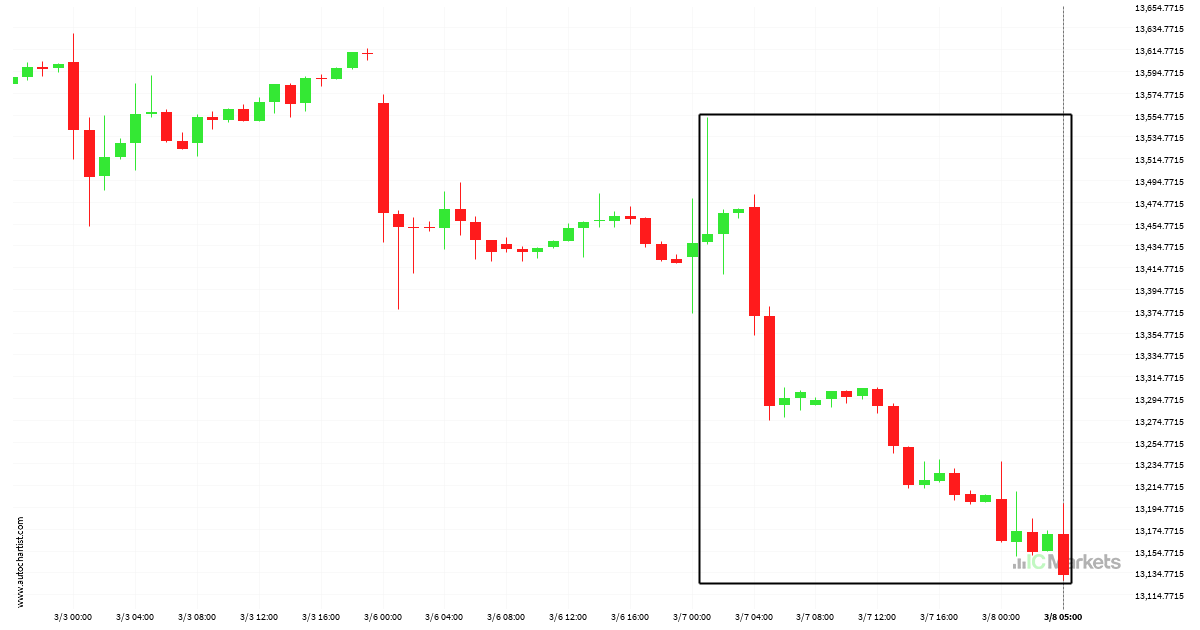
Huge bearish move on FTSE China A50 Index

FTSE China A50 Index has moved lower by 2.33% from 13445.51 to 13132.74 in the last 2 days.

Read more
March 7, 2023Australian_Stocks_enIC Markets

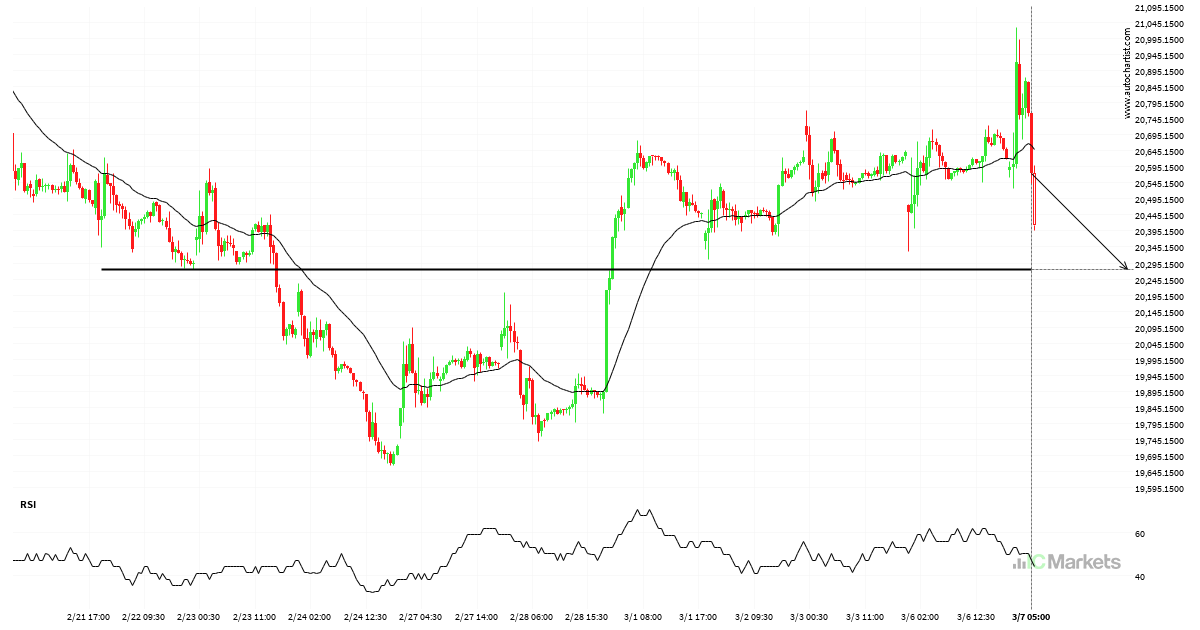
Breach of important price line imminent by Hong Kong 50 Index

Hong Kong 50 Index is moving towards a line of 20274.0000 which it has tested numerous times in the past. We have seen it retrace from this position in the past, so at this stage it isn’t clear whether it will breach this price or rebound as it did before. If Hong Kong 50 Index […]

Read more
March 6, 2023Australian_Stocks_enIC Markets

Important price line breached by FTSE China A50 Index

FTSE China A50 Index has broken through 13485.5703 which it has tested numerous times in the past. We have seen it retrace from this price in the past. If this new trend persists, FTSE China A50 Index may be heading towards 13301.4883 within the next 2 days.

Read more
March 5, 2023Australian_Stocks_enIC Markets

What’s going on with Australia 200 Index?

Those of you that are trend followers are probably eagerly watching Australia 200 Index to see if its latest 0.94% move continues. If not, the mean-reversion people out there will be delighted with this exceptionally large 13 hours move.

Read more
  • 1
  • 2
  • 3
  • …
  • 44
  • 45
  • 46
  • 47
  • 48
  • 49
  • 50
  • …
  • 153
  • 154
  • 155

Recent Posts

  • US Wall Street 30 Index – المستوى الرئيسي – مقاومة
  • Brent Oil vs US Dollar – نموذج الرسم البياني – قناة صاعدة
  • Brent Oil vs US Dollar – نموذج الرسم البياني – قناة صاعدة
  • Hong Kong 50 Index – نموذج الرسم البياني – مثلث صاعد
  • Hong Kong 50 Index – รูปแบบกราฟ – สามเหลี่ยมขาขึ้น

Recent Comments

    Translation


     Edit Translation

    Negocie com um

    líder de mercado no qual possa confiar

    ABRA UMA CONTA DE NEGOCIAÇÃO TESTE UM DEMO GRATUITO

    Trading com Forex

    • Visão Geral de Contas
    • Abrir uma Conta
    • Lançar Web Trader

    Especificações de Trading

    • Spreads e Comissões
    • Gama de Mercados
    • Horas de Trading
    • Financiamento
    • Levantamento

    Acerca da IC Markets?

    • Help Center
    • Porquê a IC Markets
    • Regulamentação
    • Documentos Legais
    • Contacte-nos


    Forex Trading

    • Accounts Overview
    • Open an Account
    • Launch Web Trader

    Trading Specifications

    • Spreads and Commissions
    • Range of Market
    • Trading Hours
    • Funding
    • Withdrawal

    About IC Markets

    • Chat with a Specialist 24/7
    • Why IC Markets
    • Regulation
    • Legal Documents
    • Contacte-nos

    Isenção de Responsabilidade: Este material corresponde a material de marketing em que todo o material de marketing é publicado apenas para fins informativos. Este material não contém e não deverá ser considerado como contendo - aconselhamento de investimento e recomendações ou sugestões para adotar quaisquer ações relativamente a instrumentos financeiros. Os widgets incorporados pertencem aos seus autores externos independentes e a IC Markets não é responsável pelo seu conteúdo ou pelo seu impacto na negociação.

    Todos os direitos de conteúdo reservados. As opiniões dos autores poderão não coincidir com a opinião dos editores do blog. Aquando da cópia de materiais a partir deste site ou aquando da ligação ao RSS feed, para republicar os nossos artigos, é necessário um link para a IC Markets ou a atribuição no formato 'IC Markets Blog'. Para questões gerais, por favor, entre em contato com a agência editorial através do formulário da nossa página de Contato.

    Alerta de Risco: A negociação de Derivados acarreta um elevado nível de risco para o seu capital e deverá negociar apenas com dinheiro cuja perda possa suportar. A Negociação de Derivados poderá não ser adequada para todos os investidores e, como tal, por favor, certifique-se de que entende plenamente os riscos envolvidos e procure aconselhamento independente, se necessário. Deverá ser considerada uma Declaração de Divulgação de Produto (PDS) antes de efetuar uma transação connosco.

    O conteúdo desta página corresponde apenas a informação geral e não tem em conta a sua situação pessoal, objetivos ou necessidades financeiras. Cabe-lhe a si certificar-se de que os produtos que nós oferecemos se adequam às suas necessidades específicas. Não deverá negociar connosco, a menos que entenda as caraterísticas e os riscos dos produtos que nós oferecemos. Isto significa que poderá precisar de procurar aconselhamento independente antes de começar a negociar connosco.

    © 2022 Raw Trading Ltd | All rights reserved.
    • Sample Page